
What is inflation, exactly? Inflation reflects how quickly the prices of goods and services are rising due to disruptions within the market. It is often a result of the aftermath of an event that affects a country or the entire world, such as wars and pandemics. This rise in prices negatively affects the economy and leads to a loss in purchasing power for both consumers and businesses.
Due to world wars, recessions, pandemics, and even policies that allowed the money supply to grow rapidly; the U.S. inflation rate has been constantly fluctuating over the past century. The MadisonTrust.com research team created a timeline of the U.S. inflation rate by year since 1914, highlighting the ten highest and the ten lowest annual inflation rates during that time, to compare historical inflation rates in U.S. to the increasing inflation rate of the current day. Explore the inflation rate chart below to see how the economy has fared since the Consumer Price Index (CPI) started being used to measure the rate of inflation in the United States.
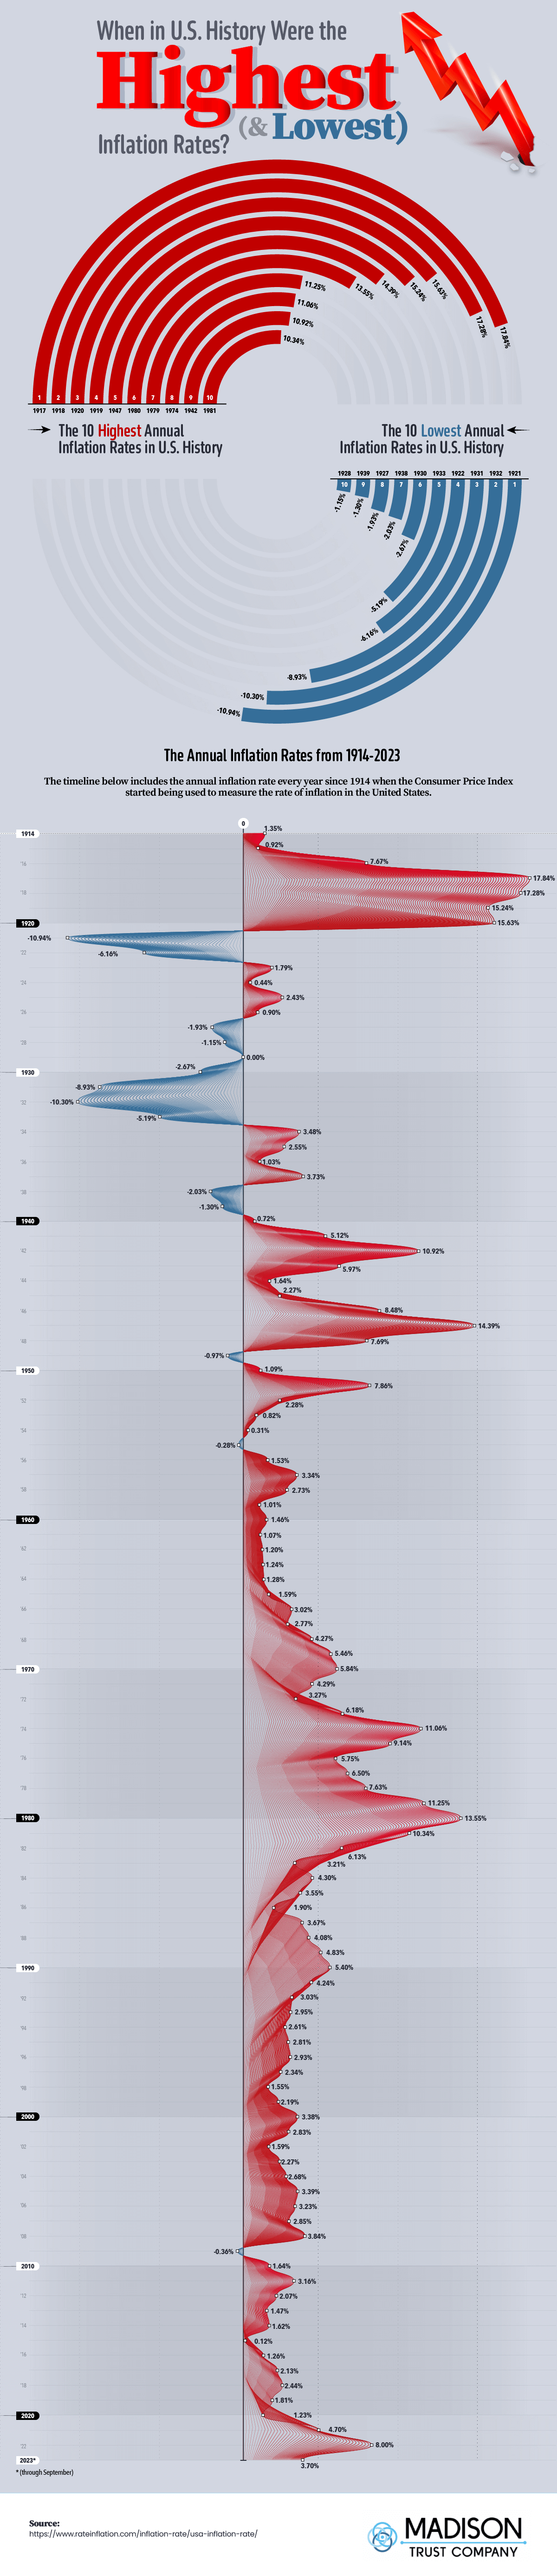
When Was the U.S. Inflation Rate the Highest?
The highest inflation in U.S. history was in 1917 when annual inflation reached a rate of 17.84%. The inflation rate of the following three years, from 1918 to 1920, rounded out the top four years with the highest rates in U.S. inflation rate history. Why was inflation in the United States so high during this time? The aftermath of WWI caused prices to drastically rise on goods and services across the country and led to the highest inflation rates ever seen since the CPI started being used to measure inflation. Prices increased by more than 80% during this period in time.
The 10 Highest Annual Inflation Rates in U.S. History
- 1917: 17.84%
- 1918: 17.28%
- 1920: 15.63%
- 1919: 15.24%
- 1947: 14.39%
- 1980: 13.55%
- 1979: 11.25%
- 1974: 11.06%
- 1942: 10.92%
- 1981: 10.34%
When Was the U.S. Inflation Rate the Lowest?
The lowest inflation rate in U.S. history was in 1921 when rates reached -10.94%; as inflation decreases to a negative level it is then considered to be deflation. This low rate immediately followed the U.S.’s historically high inflation rates due to a downturn as society struggled to transition from a wartime recession to a peacetime economy. The rest of the 1920s saw low inflation rates until the Great Depression began in 1929 which kicked off several years where inflation rates dropped and reached a low of -10.30% in 1932.
The 10 Lowest Annual Inflation Rates in U.S. History
- 1921: -10.94%
- 1932: -10.30%
- 1931: -8.93%
- 1922: -6.16%
- 1933: -5.19%
- 1930: -2.67%
- 1938: -2.03%
- 1927: -1.93%
- 1939: -1.30%
- 1928: -1.15%
What Causes the Inflation Rate to Rise?
Inflation is caused by an imbalance between supply and demand for basic goods and services. As supply levels struggle to keep up with demand, prices will begin to rise. A recent example of inflation is when supply chains around the world fell behind as businesses began to close at the start of the COVID-19 pandemic. As consumer demand for goods grew, so did their prices. Grocery basics like eggs, meat, and dairy were hit the hardest by inflation with eggs more than doubling in price.
When inflation rates begin to rise, the government will often increase interest rates to help fight it. How does raising interest rates help inflation? Higher interest rates can lead to a decrease in consumer spending, which will then allow prices to lower as supply is able to catch up to the lower demand.
Will the Inflation Rate Continue to Rise?
The 8% annual inflation rate of 2022 was the highest level of inflation in the United States since the early 1980s. What is the current U.S. inflation rate? The rate of inflation in 2023 has since dropped to 3.7% as of September, although it still remains above the Federal Reserve’s target of a 2% annual inflation rate. The Survey of Professional Forecasters predicts that the 2024 inflation rate will continue to decline to 2.5%.
Does the Inflation Rate Affect Your Retirement?
The fluctuating inflation rate can impact your retirement savings over time depending on the type of investments made. Stock prices can drop as consumers spend less leading to lower profits for companies. While increasing interest rates can help fight inflation, they also cause bond yield prices to increase which then decreases the value of the bonds. How can you protect your retirement savings from inflation? Diversifying your portfolio beyond Wall Street can help protect your assets from the volatility of the market. Alternative assets to invest in can include real estate, commodities, or precious metals. A Self-Directed IRA is one retirement account option that can be used to diversify your portfolio with a variety of assets. Learn more about the many benefits of a Self-Directed IRA and how it can protect your hard-earned retirement savings during uncertain economic times.
The Annual Inflation Rates from 1914-2023
|
Year |
Annual Inflation Rate |
|
1914 |
1.35% |
|
1915 |
0.92% |
|
1916 |
7.67% |
|
1917 |
17.84% |
|
1918 |
17.28% |
|
1919 |
15.24% |
|
1920 |
15.63% |
|
1921 |
-10.94% |
|
1922 |
-6.16% |
|
1923 |
1.79% |
|
1924 |
0.44% |
|
1925 |
2.43% |
|
1926 |
0.90% |
|
1927 |
-1.93% |
|
1928 |
-1.15% |
|
1929 |
0.00% |
|
1930 |
-2.67% |
|
1931 |
-8.93% |
|
1932 |
-10.30% |
|
1933 |
-5.19% |
|
1934 |
3.48% |
|
1935 |
2.55% |
|
1936 |
1.03% |
|
1937 |
3.73% |
|
1938 |
-2.03% |
|
1939 |
-1.30% |
|
1940 |
0.72% |
|
1941 |
5.12% |
|
1942 |
10.92% |
|
1943 |
5.97% |
|
1944 |
1.64% |
|
1945 |
2.27% |
|
1946 |
8.48% |
|
1947 |
14.39% |
|
1948 |
7.69% |
|
1949 |
-0.97% |
|
1950 |
1.09% |
|
1951 |
7.86% |
|
1952 |
2.28% |
|
1953 |
0.82% |
|
1954 |
0.31% |
|
1955 |
-0.28% |
|
1956 |
1.53% |
|
1957 |
3.34% |
|
1958 |
2.73% |
|
1959 |
1.01% |
|
1960 |
1.46% |
|
1961 |
1.07% |
|
1962 |
1.20% |
|
1963 |
1.24% |
|
1964 |
1.28% |
|
1965 |
1.59% |
|
1966 |
3.02% |
|
1967 |
2.77% |
|
1968 |
4.27% |
|
1969 |
5.46% |
|
1970 |
5.84% |
|
1971 |
4.29% |
|
1972 |
3.27% |
|
1973 |
6.18% |
|
1974 |
11.06% |
|
1975 |
9.14% |
|
1976 |
5.75% |
|
1977 |
6.50% |
|
1978 |
7.63% |
|
1979 |
11.25% |
|
1980 |
13.55% |
|
1981 |
10.34% |
|
1982 |
6.13% |
|
1983 |
3.21% |
|
1984 |
4.30% |
|
1985 |
3.55% |
|
1986 |
1.90% |
|
1987 |
3.67% |
|
1988 |
4.08% |
|
1989 |
4.83% |
|
1990 |
5.40% |
|
1991 |
4.24% |
|
1992 |
3.03% |
|
1993 |
2.95% |
|
1994 |
2.61% |
|
1995 |
2.81% |
|
1996 |
2.93% |
|
1997 |
2.34% |
|
1998 |
1.55% |
|
1999 |
2.19% |
|
2000 |
3.38% |
|
2001 |
2.83% |
|
2002 |
1.59% |
|
2003 |
2.27% |
|
2004 |
2.68% |
|
2005 |
3.39% |
|
2006 |
3.23% |
|
2007 |
2.85% |
|
2008 |
3.84% |
|
2009 |
-0.36% |
|
2010 |
1.64% |
|
2011 |
3.16% |
|
2012 |
2.07% |
|
2013 |
1.47% |
|
2014 |
1.62% |
|
2015 |
0.12% |
|
2016 |
1.26% |
|
2017 |
2.13% |
|
2018 |
2.44% |
|
2019 |
1.81% |
|
2020 |
1.23% |
|
2021 |
4.70% |
|
2022 |
8.00% |
|
2023 (through September |
3.70% |
The 10 Highest Annual Inflation Rates in U.S. History
|
Year |
Annual Rate of Inflation |
|
|
1 |
1917 |
17.84% |
|
2 |
1918 |
17.28% |
|
3 |
1920 |
15.63% |
|
4 |
1919 |
15.24% |
|
5 |
1947 |
14.39% |
|
6 |
1980 |
13.55% |
|
7 |
1979 |
11.25% |
|
8 |
1974 |
11.06% |
|
9 |
1942 |
10.92% |
|
10 |
1981 |
10.34% |
The 10 Lowest Annual Inflation Rates in U.S. History
|
Year |
Annual Rate of Inflation |
|
|
1 |
1921 |
-10.94% |
|
2 |
1932 |
-10.30% |
|
3 |
1931 |
-8.93% |
|
4 |
1922 |
-6.16% |
|
5 |
1933 |
-5.19% |
|
6 |
1930 |
-2.67% |
|
7 |
1938 |
-2.03% |
|
8 |
1927 |
-1.93% |
|
9 |
1939 |
-1.30% |
|
10 |
1928 |
-1.15% |
Would you like to display this on your website? Copy and paste the code below!
<center>
<textarea readonly>
<a href="https://www.madisontrust.com/information-center/visualizations/when-in-us-history-were-the-highest-and-lowest-inflation-rates/">
<img src="https://www.madisontrust.com/wp-content/uploads/2023/11/us-history-highest-inflation-rates-4_c.png" alt="When in U.S. History Were the Highest and Lowest Inflation Rates? - MadisonTrust.com IRA - Infographic" title="When in U.S. History Were the Highest and Lowest Inflation Rates? - MadisonTrust.com - Infographic></a><br><a href="https://www.MadisonTrust.com" alt="MadisonTrust.com" title="MadisonTrust.com">By MadisonTrust.com</a>
</textarea>
</center>