
The poverty level in the United States is around $30,000, although this amount of money can go much further in some cities than others. This data is provided by the U.S. Department of Health and Human Services and is often used for determining whether or not households are eligible for certain government programs and assistance, but it also helps paint a picture of which areas of the country are living in poverty. Which are the poorest cities in America according to this data?
The team at MadisonTrust.com analyzed the available numbers from the U.S. Census Bureau to determine the metropolitan areas that have a household income of less than $35,000. Take a look at the graphic to see how different areas around the country rank.
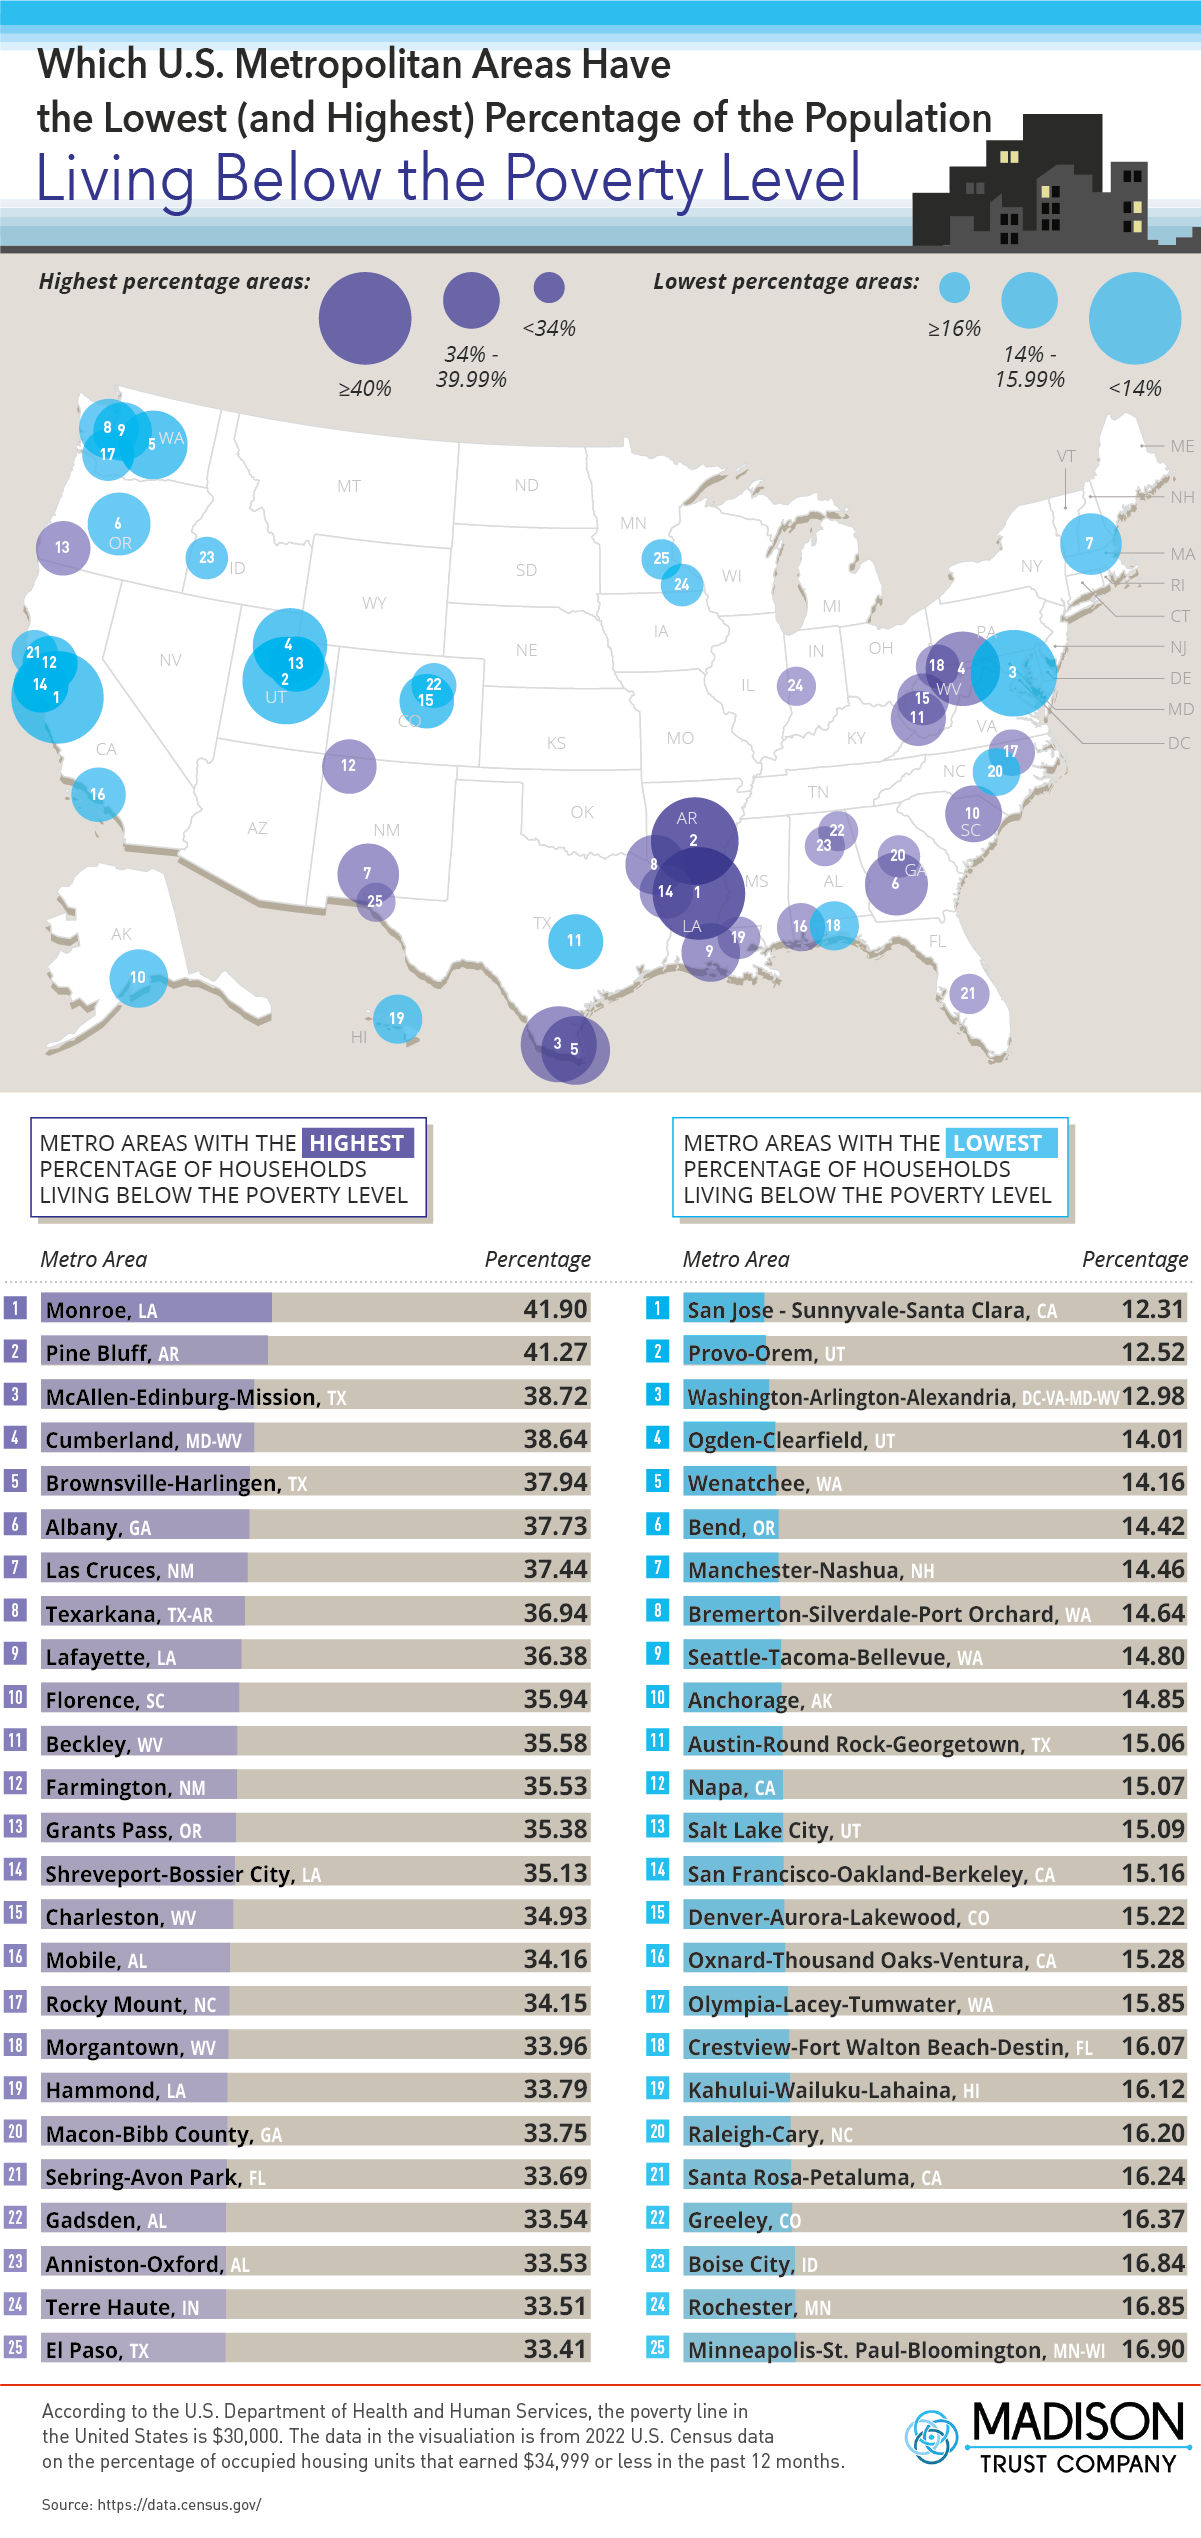
Areas With the Highest and Lowest Percentages of Households Below the Poverty Line
According to the data from the Census Bureau, the city with the highest percentage of households living below the poverty level is Monroe, LA, making it one of the poorest cities in the U.S. 41.90% of households in the area have an income of less than $35,000. Ranking second is Pine Bluff, AR, where 41.27% of households earn less than $35,000. The rest of the top 10 are McAllen-Edinburg-Mission, TX (38.72%); Cumberland, MD-WV (38.64%); Brownsville-Harlingen, TX (37.94%); Albany, GA (37.73%); Las Cruces, NM (37.44%); Texarkana, TX-AR (36,94%); Lafayette, LA (36.38%); and Florence, SC (35.94%).
The metropolitan areas in the U.S. with the lowest percentage of households living below the national poverty line are the San Jose metro area at 12.31%, Provo-Orem in Utah at 12.52%, and the Washington D.C. metropolitan area at 12.89%. While these areas have the lowest percentage of households living below the national poverty line, it should be mentioned that they also have some of the highest costs of living in the United States. These cities offer many high-paying jobs in technology and government, but those that cannot afford the high home and rental prices in these metropolitan areas are not able to live there, which may play a part in the percentage of households that are living below the poverty line.
What Are the Causes of Poverty in the United States?
There are many factors that can contribute to poverty in American households, including both social and political reasons. A common cause is the rising cost of inflation, especially since the start of the COVID-19 pandemic. The pandemic also led to a rise in unemployment, which had a huge impact on how much households earned. Some additional factors are income inequality, poor or lack of education, and debt traps. Despite being one of the wealthiest countries in the world, the United States has a high poverty rate as compared to other countries.
A study found that nearly half of Americans work in low-paying jobs, which is defined as a job that pays $18,000 or less per year. A majority of these Americans are not teenagers or people just beginning their careers, but rather adults in the prime of their working years.
What States Have the Highest Poverty Rates?
The poorest states according to the U.S. Census Bureau are Louisiana, Mississippi, New Mexico, West Virginia, and Kentucky. The five richest states in the country are New Jersey (home to three of the 15 wealthiest counties in America), Maryland, Massachusetts, Hawaii, and California.
Ways to Build Financial Security
Financial security is tied to a number of things including household income, cost of living in the geographic area, expenses, wealth inequality, and housing opportunities. Some of these factors are fixed for many Americans and cannot be easily improved, but for those who are in the financial position to do so, the following can be effective ways to increase wealth and find a more secure financial footing:
- Determine your baseline level of income
- Create a budget for all necessary expenses
- Find a budgeting method that works for you (envelope budget, 50/30/20 budget, zero-based budgeting, etc.)
- Cut down as many unnecessary expenses as possible including dining out and takeout
- Evaluate your retirement savings options including a 401k and a self-directed IRA
- Consider a side gig to help increase your yearly earnings
- View your savings as another monthly bill to ensure you contribute to your bank account each month
- Build up an emergency fund for when unexpected expenses come up or times are tight
- Continue paying down your debts like credit cards, mortgages, and loans
While the road to achieving financial security is challenging for most Americans, taking small steps now can make a big difference in the future.
Metro Areas With the Highest Percentage of Households Earning Less Than $35,000
|
Rank |
Metropolitan Area |
Percentage |
|
1 |
Monroe, LA |
41.9 |
|
2 |
Pine Bluff, AR |
41.27 |
|
3 |
McAllen-Edinburg-Mission, TX |
38.72 |
|
4 |
Cumberland, MD-WV |
38.64 |
|
5 |
Brownsville-Harlingen, TX |
37.94 |
|
6 |
Albany, GA |
37.73 |
|
7 |
Las Cruces, NM |
37.44 |
|
8 |
Texarkana, TX-AR |
36.94 |
|
9 |
Lafayette, LA |
36.38 |
|
10 |
Florence, SC |
35.94 |
|
11 |
Beckley, WV |
35.58 |
|
12 |
Farmington, NM |
35.53 |
|
13 |
Grants Pass, OR |
35.38 |
|
14 |
Shreveport-Bossier City, LA |
35.13 |
|
15 |
Charleston, WV |
34.93 |
|
16 |
Mobile, AL |
34.16 |
|
17 |
Rocky Mount, NC |
34.15 |
|
18 |
Morgantown, WV |
33.96 |
|
19 |
Hammond, LA |
33.79 |
|
20 |
Macon-Bibb County, GA |
33.75 |
|
21 |
Sebring-Avon Park, FL |
33.69 |
|
22 |
Gadsden, AL |
33.54 |
|
23 |
Anniston-Oxford, AL |
33.53 |
|
24 |
Terre Haute, IN |
33.51 |
|
25 |
El Paso, TX |
33.41 |
Metro Areas With the Lowest Percentage of Percentage of Households Earning Less Than $35,000
|
Rank |
Metropolitan Area |
Percentage |
|
1 |
San Jose-Sunnyvale-Santa Clara, CA |
12.31 |
|
2 |
Provo-Orem, UT |
12.52 |
|
3 |
Washington-Arlington-Alexandria, DC-VA-MD-WV |
12.98 |
|
4 |
Ogden-Clearfield, UT |
14.01 |
|
5 |
Wenatchee, WA |
14.16 |
|
6 |
Bend, OR |
14.42 |
|
7 |
Manchester-Nashua, NH |
14.46 |
|
8 |
Bremerton-Silverdale-Port Orchard, WA |
14.64 |
|
9 |
Seattle-Tacoma-Bellevue, WA |
14.8 |
|
10 |
Anchorage, AK |
14.85 |
|
11 |
Austin-Round Rock-Georgetown, TX |
15.06 |
|
12 |
Napa, CA |
15.07 |
|
13 |
Salt Lake City, UT |
15.09 |
|
14 |
San Francisco-Oakland-Berkeley, CA |
15.16 |
|
15 |
Denver-Aurora-Lakewood, CO |
15.22 |
|
16 |
Oxnard-Thousand Oaks-Ventura, CA |
15.28 |
|
17 |
Olympia-Lacey-Tumwater, WA |
15.85 |
|
18 |
Crestview-Fort Walton Beach-Destin, FL |
16.07 |
|
19 |
Kahului-Wailuku-Lahaina, HI |
16.12 |
|
20 |
Raleigh-Cary, NC |
16.2 |
|
21 |
Santa Rosa-Petaluma, CA |
16.24 |
|
22 |
Greeley, CO |
16.37 |
|
23 |
Boise City, ID |
16.84 |
|
24 |
Rochester, MN |
16.85 |
|
25 |
Minneapolis-St. Paul-Bloomington, MN-WI |
16.9 |
Would you like to display this on your website? Copy and paste the code below!
<center>
<textarea readonly>
<a href="https://www.madisontrust.com/information-center/visualizations/which-us-areas-have-lowest-and-highest-percent-population-below-poverty-level/">
<img src="https://www.madisontrust.com/wp-content/uploads/2024/01/poverty-level-2.png" alt="Which U.S. Metropolitan Areas Have the Lowest (and Highest) Percentage of the Population Living Below the Poverty Level? - MadisonTrust.com IRA - Infographic" title="Which U.S. Metropolitan Areas Have the Lowest (and Highest) Percentage of the Population Living Below the Poverty Level? - MadisonTrust.com - Infographic></a><br><a href="https://www.MadisonTrust.com" alt="MadisonTrust.com" title="MadisonTrust.com">By MadisonTrust.com</a>
</textarea>
</center>